Friday, November 16, 2012

Economic Crisis 2008 – Chronology of Events

This write-up only touches the main historical events which lead to the 2008 Economic crisis. More elaborate discussions on the Crisis and bubble will follow this post.

When did the crisis started?
  • 2007?
  • 2001?
  • 1999?
  • 1981?
  • 1973?
  • 1971?
  • 1944?
  • 1936?
  • The year Keynesian Theory was published.
  • Keynes in a letter to G B Shaw boasted “economics would never be same again” and he was damn right as It was not.
  • Keynes taught spending as salvation, government as savior, deficit finance as the weapon.
  • He asserted ‘ unemployment and inflation are mutually exclusive
  • In decades thereafter, the western world took Keynesian advice right and very wrong.

1944 – Bretton Woods
  • IMF was established
  • Dollar was accorded the status of the King of Currencies. It was made currency of reserve.
  • Fixed exchange rates establish with currency tied to dollar and dollar to gold.
  • Undervalued currencies distorted trade.
  • US acquired enviable capacity to write ‘cheque on it self’.
  • And US used the prerogative abundantly
  • And irresponsibly with excesses in spending and debt.
  • US deficits in budget, in trade, US expanding money supply and US debt wrote the script of crisis.
1971 – Nixon
  • Nixon closed the gold window ending twenty five years of fixed prices giving way to more excesses and loss of faith in dollar.
  • Smithsonian realignment of currency was short lived.
1973 – Oil Shock
  • OPEC oil shock changed the macroeconomic of world
  • Oil producing countries acquired upper hand and license to amass wealth
  • US developed vested interest in high oil prices – as producer and as beneficiary and keeper of oil wealth.
  • Keynes’ exclusivity of unemployment and inflation went for a toss creating dilemma and inefficacy of monetary and fiscal policy which aggravates crisis. 
  • G7 decided to maintain value of Dollar by intervention.
1981 – Regan and Deng Xiaoping
  • Backlash of capitalism and free market – not only in the west but in Communist China
  • Deregulation and encouragement to amass wealth
  • 401 (k) and other measures to create equity culture
  • Plaza meeting of G8 in 1987 and triggering depreciation of dollar – wealth acquired by countries could and did lose its value.
1999 - IT bubble, Y2K and Repeal of Glass Steagall Act
  • IT bubble is born and grows
  • Y2K facilitates ‘outsourcing’
  • Power shift
  • Rise of China as World’s factory and of India as its back office.
  • Accelerates globalization enabled by IT
  • Glass Steagall repealed wiping out demarcating line between commercial banks and investment banks. Invitation to take more risk.  This was the costliest mistake by the US senate and was done to facilitate the merger of Citigroup with Travelers. It proved to be the last nail in the coffin and the crisis became apparent in 2007-08.
2001- Bush, IT bubble burst and WTC
  • Bush paints a rosy picture of making America an Ownership Society
  • Refunds $ 168 to no avail
  • Reduces taxes. Rich get $ 450 bn + benefit out of total $ 650 bn cut
  • Capital gains tax rate (15 %) at half the income tax rate (30 %). 
  • IT bubble bursts creating ‘mini crisis of confidence’
  • Further setback with 9/11 and WTC collapse
  • Initiates Greenspan Put and Housing Bubble.
Housing Bubble -2004-07
  • Surge in housing with cheap money, easy mortgage availability and belief that house prices would always rise
  • Sub-prime and NINJA loans
  • ARM and zero and negative equity loans
  • HELCO and Refi loans making existing houses ATM
  • Alt-A loans – minimum or no documentation
  • Securitization and the finance bubble
  • 2007 Crisis Begins with Bursting of Housing Bubble Followed by Finance Sector Crisis on the Wall Street.
Growth of Economy due to the Bubble Growth
  • Housing triggers economic growth
  • With cheap money, failure rates fall; falling failure rates trigger more irresponsible lending
  • “We have no way to know a bubble till it bursts” – Alan Greenspan
  • “While the music plays, you have to dance” Charles Price, CEO Citi Group
  • 65 % home ownership in 2001, 69% in 2006
  • Sub-prime $ 145 billion in 2001 $ 625 billion in 2005
  • In 1998 Real Estate Agents 718,000; in   2006 1.37 million
  • In 2000 mortgage brokers 240,000; in  2006 418,700
  • By 2005, 40 % home purchases for investment or second homes
  • HELOC (Refi) increased from $ 59.1 Billion in 4th qtr 2001 to $ 206.7 billion in 3rd qtr 2004
  • In fall 2005, Mark Zilbert Miami Realtor launched www.condoflip.com with motto “bubbles are for washtubs”.
  • Mortgages $ 304 billion in 2001, $ 985 billion in 2004, $ 2.9 trillion in 2005.
  • ARM share 12 % of mortgage in 2001 to 19 % in 2004 to 31% in 2005
  • Foreclosure fell from 1.49 % in third quarter 2002 to less than 1 % in second quarter of 2005
  • 952 days without a bank failure since June 2004

September 2008 - Humpty Dumpty had a Great Fall
  • Bear Stearns folds up in March with high exposure to sub-prime losses
  • Dollar collapses in July 2008. Euro=$ 1.59
  • Oil at $ 147 a barrel
  • Nero fiddles “I am an optimist” – Bush in July 2008
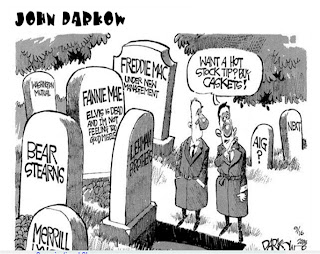
  • Avalanche moves. In September, Fannie Mae and Freddie Mac are effectively taken over
  • Money market dries. Difference in LIBOR and US 90 days TBs rises to 345 basis points
  • Crisis of confidence in markets. Dow slides
  • Lehman in trouble. Paulson decides to let it fall. On 15th September, Lehman files for Bankruptcy
  • Panic ensues
  • AIG is effectively nationalized with Govt. pumping $ 85 bn in bail out against 80% stock of AIG. Total AIG funding $ 210 bn and counting
  • House passes TARP on second attempt Bailout Package of $ 700 billion
  • Meltdown is global – Systemic risk implodes
  • Dow at less than 6,500
  • On October 13th, government recapitalizes banks – total support over time $ 350 billion
  • In November Obama wins Presidency.
    •  
Let’s look at the factors which propelled the Bubble(s)

  • Capitalist Expansion and Ownership Society
  • Cultural and Political Changes Favoring Business Success
  • New Information Technology
  • Supportive Monetary Policy and Greenspan Put. Cheap money.
  • An Expansion in Media Reporting of Business News
  • Analysts’ Optimistic Forecast. Role of rating agencies.
  • The Expansion of Defined Contribution Pension Plans (401 (k))
  • The Growth of Mutual Funds
  •  Expansion of the Volume of Trade: Discount Brokers, Day Traders and Twenty-Four-Hour Trading
  • The Rise of Gambling Opportunity. Refinancing and flipping
  • Financial innovation. Securitization, packing, repacking, slicing, debt. Alphabet soup of ARM, MBS, ABS, CLO, CDO, CDO squared, cubed, Synthetic CDO, CDS, Alt-A, SIVs, conduits.
  • Global liquidity and global market for debt paper.
  • Enhanced risk taking due to low failure rate. Sub-prime lending
  • Baseless optimism on continued rise in prices
  • Moral Hazard
  • Global savings glut (Chinese fund  American Excesses)
  • Iraq and Afghanistan Wars (Chinese pay for it)
  • Absence of regulation
  • Domino effect
  • Rising Inequality of Income – Middle Class Squeeze. Let them eat credit.
  • Increasing gap between rising productivity and constant remuneration. 

Further readings

Thursday, November 1, 2012

Why Non- Indian's are not very successful in leading Indian IT companies?

This writeup is not an analysis but an attempt to demonstrate the reason through a short story.. All names are fictitious and no such company exits to best of my knowledge. 


In May 2009, after a stint as Director of a multinational company, Andrew Tan decides to move on to join an Indian software giant, Stylus Consultancy. His vast experience of 20 years has given him the chance to be appointed as Head of Asia Pacific region. He was happy to get a one year grace period to prove his mettle and improve the declining market share of Stylus in Asia Pacific. His immediate goal was to amalgamate himself to the working culture of the company and build a rapport with the management of Stylus. 

His appointment was not liked by Rajan who is the present deputy head and is being with the company for last 22 years, having experience working on various positions and markets. Being so long in the organization he is acquainted with the organization philosophy and is also close to the senior management team. He was under the pretense to be next Head of Asia Pacific region and often boasted that he has seen it all and nobody knows more than him about the company.

Andrew was out rightly rejected by Rajan and other peers and kept telling him that “we have seen many as you coming and leaving the company within a year”. He being a winner throughout is professional career took this as a challenge. Andrew realized that though his job is to generate sales, he needs to work very closely to the operations team which is largely Indian workforce. He soon found that the though the company is global with operation in more than 100 countries, the style of management is still very much local to India.

Initially it was really difficult for Andrew, to understand the working culture and the dynamics of Stylus, and found it extremely difficult to generate enough enthusiasm in his immediate subordinates to support him in his endeavors. Andrew was constantly challenged by Rajan on his initiatives and suggested on various occasions that this is bound to fail as he himself has tried something similar and it has been a disaster. Not only Ranjan will have non-cooperation attitude, he will also influence his other colleagues and create situations to prove that he is giving right inputs but Andrew is not taking steps in the interest of the company. Andrew worked hard for the first six months make his presence felt and also marginally increased the business volume. The business growth came mainly through his personal contacts which he built over years. 

Stylus being a giant and global has operations in about 100 countries but most of the focus for last 20 years has been in North America. As part of his induction Andrew was invited to look into the North American model. He observed that North America being the first mover’s has a matured models and company executives has built good rapport with the clients over the years. With the new wave of off-shoring which was mainly due to increasing cost of Indian labor force in the software sector; company has established itself as a niche player and is passing the cost advantage to its customer. North America has been the cash cow for the company and most of company’s resources and competent staffs are engaged to support the North American clients. 

Ajay Mallaya, Stylus CEO is one of the most aggressive CEO’s any software company has seen so far and he has been successfully growing the company at a rate of 50% percent for the last 5 years. Ajay has been contemplating that the US slowdown, with bleak chances of recovery will have negative impact to the company’s revenue and he needs to find new avenues fast. During his visit in December 2009 at Asia Pacific headquarters, he gave a tough task to Andrew to replicate the North American model in Asia Pacific and grow revenues by 50% year on year keeping the gross margin more than 40%. Ajay believes everything is possible if there is will and ‘something is not possible’ is not in his dictionary. Ajay has been ruthless in changing the management team if goals are not met. 

Andrew knows he has only six more months to prove himself. He sat in his office late that day wondering. Most of his time till now in Stylus has been focused on travelling to various countries, to meet the team, build a rapport and make his presence felt. Andrew is caught completely unaware of this new challenge. He has never failed before and was in dilemma how to prove himself. He brought down all his experience and started to on work his plan. He identified the major markets to be China, Singapore, Japan and Honk Kong. Other potential markets are Malaysia and Indonesia. The dilemma was how to penetrate the market given the fact that Stylus has not done well in these markets before. His experience of working in China has been quite challenging and selling software in China is even a bigger challenge. Japan being a major economy as negligible software outsourcing and also the language and culture poses a big barrier. Only a handful of Stylus employees know how to deal with Japanese. Doing business in Malaysia and Indonesia has its own challenges as company has very strict ethical policies which are to be complied with. All expenses incurred in business developed are to be audited for and business does not come easy in this region without giving a cut to the clients or pay through agents indirectly. Stylus has not invested enough time and resources to build strong relationship in this region in the past. Few of the other challenges he thought about is rampant software piracy and customer’s not paying in time or not paying at all. Further to this there is fierce completion from other international players and over the years, Philippines and China have grown their own talent and giving a tough time to Indian software exporters. Stylus like most of the other Indian software giants is good in software services but not strong in software products. The cost of service offering to Asia Pacific, barring Japan has to be very competitive and Andrew knows that Stylus is not a cheap software supplier. 

Stylus has been doing well in English speaking countries but doing well in these nations which requires different language skills and adapting to the culture is a big shift. Considering most of the Indian work force is not equipped to handle these languages and culture, Andrew gets into deep thoughts and more he thinks he is more worried. He decides to call Rajan to discuss and brainstorm the future plan and knowing the equation well Andrew is not prepared to share his concerns. Rajan seemed professional and shared some of his concerns but gave him very vague and hypothetical solutions on how to develop the market. Rajan draws up a training plan to get the Indian software professionals train on local culture and language. Draws an aggressive selling plan to travel and meet prospective clients over the next 90 days. Andrew was thinking how he can go about it without having an understanding of client’s needs and agenda. None of the solutions seems to bear fruit in short term. Andrew knows very well that Rajan is waiting for the opportunity for him to fail.

Andrew is thinking deeply how a global company like this did not have a long term plan demands to change the game overnight. He is running out of options and is very sure that whatever he does will not meet the set targets. The words “we have seen many of you coming and leaving the company within a year” is echoing in his mind. He has been a winner always and first time in his career he is afraid to loosing. On his way back to his home Andrew is weighing his options whether to go back to CEO and tell the facts and get fired or leave the company and move on.

Question: Should Andrew continue this challenge?

Friday, October 12, 2012

Did facebook fool investors ?

Lot of experts have already written a lot about facebook IPO , the subsequent stock price fall and impact on the investor community. Investors have subsequently filed lawsuit against the underwriters and facebook for hiding information prior to IPO. The question is is the investors so naive that they could not look at the risks themselves and they had to bank on analysts and underwriters declaration. This is one of the classic case where company fundamentals were totally ignored and speculation and greed overshadowed. I got a chance to analyze this issue recently and below are just some thought processes which came across to my mind. 

Facebook is the most famous social networking site with 900+ million users and have made an IPO debut on 18th May 2012. Facebook was valued $104 billion with an offer price of $38 at the time of IPO , which made it one of the biggest company to go public in the US history. After the debut the share price saw a constant fall and is now (11th Oct end of day price) trading at close to $19.45, which is about 50% lower than the offer price. Although there was overwhelming responses from the investors oversubscribing the IPO by more than 10 times, there were few fundamental risks involved in the company which investors overlooked . Few of those risk factors which probably investors overlooked :

Future Growth 
Facebook revenue stream is generated fundamentally by advertising which contributes to 85% of the revenues. The cash flow is tied to just one vertical and any fluctuation will have an impact in the company valuation. In terms of user base facebook has saturated some of its key first world markets in terms of user counts. It’s very difficult for facebook keep increasing the user base as what it has done in the last couple of years. 

The ad revenues are directly linked to the number of users clicking the ad banners and with markets getting saturated the ad revenues may remain constant or slide in the event facebook is not able to bring new well received products and unable to balance the user experience with the ads. Moreover almost half of the advertisers see that ad dollars spent on facebook is “experimental” and as a result the ad revenues have gone down by 6% in the Q2. General Motors Co has pulled out $10 m ads from facebook at the time of its IPO and more and more advertisers are following suit. 

Mobile Users 
Almost about half of 900m user’s user mobile channel to access facebook and its mobile sites do not show ads of any kind. Facebook has not been able to successfully monetize its mobile user base. Moreover facebook do not own any proprietary mobile device or OS. Facebook competitors Google give preference to Google+ and iOS provides twitter as its identity provider and native sharing options. Google and Apple control the native in-app payment systems could effectively box facebook out of the mobile app market. 

Competition 
Facebook faces a significant amount of competition from the likes of Google, Microsoft and Twitter, as well as other social networks from around the world. Facebook's competitors may acquire and engage users at the expense of growth or engagement of their user base, which would negatively impact Facebook's business and financial results. Acquisitions or consolidation within Facebook's industry may result in more formidable competitors. 

Government Censorship and Privacy Regulation 
Facebook is an international business; it is available in more than 70 languages and has offices or centers in more than 20 different countries. Facebook are subject to a variety of risks inherent to businesses operating internationally like: 
  • Social, political or economic instability. 
  • Potential damage to Facebook's brand reputation due to compliance with local laws, including potential censorship. 
  • Facebook face risks relating to the legal and regulatory environment in foreign jurisdictions. 

Facebook has attempted to give users more control about how much of their information can be made public, but the company never revealed clearly how they are using the data internally. Investors realize that the personal information which facebook holds is the single biggest selling points to its ad customers. In the event of misuse of data, public backlash or government sanctions the revenues will nosedive. 

Management Team 
Facebook is a two headed company , CEO Mark Zukerberg who makes products and CIO Cheryl Sandberg who is responsible for making money. They have unconventional way of running the business , not much of discussions and no formal approach before deciding on the investment. Mark Zukerberg is just one person who have authoritarian rule over facebook. He even spent $1b in instagram without consulting anyone. The business is not run in a corporate style and in the event something tragic happens to Mark , or he makes a big mistake the whole company will be in jeopardy.


Do investors have legitimate claim for compensation?

The basis of the lawsuits against facebook and its underwriters is the accusation that "underwrites disclosed the change in analyst’s forecasts selectively and have made a fraud in sizing up the offer price". As per SEC regulation facebook has highlighted the risk factors and gave enough indications in the IPO prospectus. Facebook has clearly mentioned the risk factors on -competition, worries about slowing of advertisement revenues and also acknowledged that revenue is not going to grow at the same rate. Specific disclosures include that revenue fell by 6% and profit by 32%. There were other warning for investors too, General Motors pulling out the advertisement and facebook itself acknowledging that there is lot advertisers have shown skepticism and they consider the site experimental. 

On May 15th the price was boosted to $38 and news was already out that insiders were selling 84 million more shares. Pricing the stocks at high end range and cashing out on the investor interest is not wrong as per the law. It may be termed as greed or short shortsightedness but not illegal. At the time of trading the price to earnings ratio is close to 120, which by any means it’s too high and leaves zero margin of safety .Seasoned investors is expected to know this basic fundamental that issue is overpriced and use their judgement while subscribing. 

Most of the investors have ignored the risk factors, and the fact that offer price is high end, but still they have gone ahead to investment on a hope to get a return on the first day of the trading. Most of the investors have subscribed to the IPO not on the hope that it has long term prospect, but rather to make money on the first day of the trading. Although there was glitch in the NASDAQ system because of which the matching price was not done correctly and because of which some of the investors lost money. But it’s a zero sum game, some may have gained and some lost. Investors may claim that money lost due to incorrect matching prices and underwriters or NASDAQ may compensate for that .But legally there is isn't much merit for investors to sue facebook. 

The writing was there on the wall and it was more of investor’s greed to cash out of the first day of the trading and over-subscription and investor interest cannot be attributed directly attributed to the valuation or disclosure. SEC rules states that ,analyst’s forecasts and views need not necessarily be included in the prospectus, so there is not much merit to sue facebook. . My view is that , as long as the rules of listing are followed, facebook and underwriters have not broken any law. So it is unlikely that the investors will get any  compensation for trading losses.


Looking from facebook perspective , was this IPO a success?

There are two ways to look at it, one from the investor’s perspective and one from the facebook and its underwriters. On the first day of the trading , intraday stock price rose to $42 and closed at 23 cents above the issue price of $38. Most of the first day cashers would have recovered their investments (ignoring cost of investment) , but overall the performance did not live up-to the expectation of investors. 

From the facebook and its underwriters perspective the deal was pretty good. The company and underwriters did not leave much money ( actually no money) on the table. The social media giant raised a hefty $104 billion, much of which will go into the company coffers. It also created a host of newly minted billionaires and millionaires, from its 28-year-old founder/CEO Mark Zuckerberg, down to most of Facebook’s 3,500 employees. Why I say underwriters did a damn good job is - the IPO was done in a time when the broader market was declining. 

It is important to remember that IPO is to raise capital and raise it as much as possible. The reasons for raising capital vary from supporting a business' growth to insiders cashing out, among others. Facebook managed to raise about $104 billion, the high end of its desired range. By this measure, the Facebook IPO was a smashing success. 

The fundamental issue in the IPO were- i) "quantum of shares" floated in the IPO and ii) facebook clearly misjudged the demand for the shares. Probably the market did not have that kind of appetite. Underwriters have dual role to play, one not to leave too much money on the table and another to leave some room for the investors to make money and this equilibrium creates the initial market is created. Underwriter’s maximized the price for facebook but failed to read the investors sentiments. 

Conclusion
Best investments are determined over months and years and not in hours and days. The long term investors may not be too unhappy as the company has got plenty of capital to take on the competitors ,and may come out with innovative products and new ways to make more money. Anyone investing in an IPO  and looking for a day one “pop” is trying to speculate the short term market behavior. Long-term success of a company isn't predicted by the initial trading of its shares but on a much longer term. Any company that controls online distribution for nine hundred million people and counting has the potential and long term investors are looking forward to that. It’s possible that many of the IPO investors are holding on to the stocks and bullish on facebook’s future.

Conclusion is - facebook and underwriter’s failed to judge the demand and the fact that offer price was at a higher end.Just considering the IPO , I think it was a success as the primary motive of raising capital was hugely successful. The company ended up a winner, although the short term investors and speculators (who predicted price rise) might not have.

Monday, October 1, 2012

Employee Appraisals - Is Forced Rankings or Normalization only way out?


How do you feel when in the name of normalization you and pushed down ? Is it not a fare expectation from organization that you should be able to understand the organization philosophy and appreciate this global best practice? I call it best practice because more that top 80% of global firms practice and preach the normalization process in performance appraisals. The whole problem with this system is even if you are "Kumbhakarna" but have been awake on the right part of the year and fought a small war ,you will get your reward for sure.

Scientists have proved that every every phenomenon when measured forms a normal curve distribution. Mathematicians have come up with smart formulas and gave us tools to predict a behavior. Even the salt particles movement dissolved in a glass of water "Brownian Motion" which looked so unpredictable also follows a normal distribution. 

Can we extrapolate that human mind fluctuations also follows a normal curve?Can human mind and emotions be modeled into a mathematical equation? I personally find it hard to believe and believe most of my friends would concur. 

Coming back to my topic , how many of you believe that there is no subjectivity involved in the appraisal process and your manager have only looked at your performance before assigning a number to to you.Most of us wound't mind it had it not hit your wallets. But then a manager is also a human being and he also have to earn his bread. 

Will it be fare to say that -then why do not firms move away from this "best practice" and think something out of the box or make it simple enough to understand and measure. Well simple practices actually do not give  the organization the edge ; i.e to be seen as a leader you must have complex processes which can be attributed to this VUCA (Volatile, Uncertain, Complex , Ambiguous) environment.

So whats the way out?
I personally feel a simple system can be created , which can essentially would capture feedback on the KPI's or deliverable assigned to a poor soul. This feedback capturing can be done done like monthly by the manager. Since manager will not have to keep a log or remember hard enough when his subordinate did not listen to him before assigning a number at the end of the year. Poor manager may find it easy to just add few lines as monthly feedback. By this way no one will suffer from memory loss syndrome as one month is quite a short period. For the purpose of measurements these can be assigned a number in the scale of 1 to 10.

These feedback's then be aggregated in the yearly appraisal to come out with a number. The question still remains what to do with the aggregate numbers ? Normalize them again :) ?

I would recommend to see the total of these numbers within your team ,and I am 100% sure the distinction will show up on its own. Employees will not come and cry,shout or threaten at the end of the year ,as they would be the testimony of their own performance.

Tuesday, September 11, 2012

Micro Economic Study of India Telecom Industry


Market Structure

Indian telecommunication market is one of the largest in the world, with the number of telecom subscribers second only to China's. In terms of infrastructure, India's telecommunication network is the third largest in the world on the basis of its customer base and it has one of the lowest tariffs in the world enabled by the hyper-competition in its market. The major sectors of the India telecommunication industry are telephony, internet and broadcasting. Indian telecom industry underwent a high pace of market liberalization and growth since 1990s and now has become the world's most competitive and one of the fastest growing telecom markets. India has the world's second-largest mobile phone user base with over 929.37 million users as of May 2012. It has the world's third-largest Internet user-base with over 121 million as of December 2011.


There are around 15 operators competing in the market for the telecom space in India. As per the latest annual report from Telecom Regulatory Authority of India (TRAI), the total revenue in the telecom service sector was INR 1,71,719 crore for the 2010-11 , growth of about 8.7% from the previous year. The capital employed in the sector increased from INR 2,86,837 crore in 2009-10 to INR 3,37,683 crore in 2010-11 i.e. an increase of 17.73 % indicating a healthy growth of investment in the sector.

There are three types of players in Indian telecom services:
  • · State owned companies (BSNL and MTNL)
  • · Private Indian owned companies (Reliance Infocomm, Tata Teleservices,)
  • · Foreign invested companies (Vodafone, Bharti Tele-Ventures, Idea Cellular, Uninor etc)
Foreign direct investment is increasing and new players are entering the market every year.

Competitive Scenario

Owing to the huge competition among the players, price wars are quite evident. 15 years ago subscribers were made to pay for an incoming call; today they have the liberty to pay for per second of their usage, with TATA DOCOMO bringing the market disruption by their concept of per second billing. 

The Indian mobile services market is more or less equally divided between GSM and CDMA customers with the former capturing around 53% of the subscriber base. Currently there are 11 players who are fighting tooth and nail to increase even one single percentage point in their market share. While Bharti Airtel dominates the GSM arena, Anil Ambani led ADAG‘s Reliance communications has been leading the CDMA services space in mobile telephony but the good sign for the sector is that revenues of all the incumbents have increased leading to an increase in their revenues. In GSM, Bharti Airtel is given a tough competition by Vodafone and Tata Teleservices which operates Tata Indicom and in CDMA, it is considerably behind Reliance communications in terms of market share. With Mobile number portability coming into the scene, the war will be fiercer in this space and there will be a huge swapping of subscribers among the existing players.

Trends in Demand Supply

Demand Analysis:

  • The majority of the Indian population is in the age group of 15-64 years. Mostly users of mobile phones belong to this category of age. Hence, Indian holds a great potential market for telecom service providers. Even young generation of India is attracted more and more towards cell phones and this has become a trend and need of even small children in India. This assures a high growth in this industry in future.
  • Most of the service providers have covered majority of the urban population of India. But many far fledged villages of India still need to be connected through mobile phones. The untapped rural population of India is a huge proportion of the 72.2% total rural population of India. Also, the demand for telecom service in rural people is increasing day by day. This further ensures growth in the industry.
  • Indian telecom continues to register a significant growth each year. This has been due to the impact of economic reforms and pro-active policies of the government. 
  • The growth of wireless services has been phenomenal, with wireless subscribers growing at a compound annual growth rate (CAGR) of 87.7 per cent per annum since 2003. The share of private sector in total telephone connections is now 77% per cent as per the latest statistics available for Year 2011 as against a meager 5% in 1999.
  • It is also envisaged that internet and broad-band subscribers will increase to 50 million and 25 million, respectively, by 2014. As per the latest available statistics for September 2010, about 12% villages have broadband coverage.
  • Foreign direct investment (FDI) is one of the important sources to meet the huge funds that are required for rapid network expansion. The FDI policy provides an investor-friendly environment for the growth of the telecom sector. The policy of the Government of India is to strive to maximize the developmental impact and spin-offs of FDI. At present, 74% to 100% FDI is permitted for various telecom services. The total FDI equity inflows in telecom sector have been 1451 million USD during 2009-10.

Supply Analysis:

  • Degree of Concentration : The telecommunications industry is a vast one with a large number of private players who are constantly bringing down the cost to consumers thereby making services more affordable and helping improve life in general and business in particular. On the Indian business scene are successful government owned institutions like MTNL and BSNL on the one hand, and even more successful and aggressive players like the Tata’s and Reliance on the other. Competition has just begun and is heating up every day with either lowering of tariffs or introduction of newer and improved services to keep a larger share of the market. Reliance, for instance, has been one of the recent, more aggressive players in the telecom business when it introduced a wireless phone in the market for as low as Rs. 500.
  • Ease of entry: Friction exists between existing players and the newer entrants, as also between the providers of services based on different technologies (CDMA Vs Cellular). The same needs to be resolved with government intervention through the regulator in order to further improve the services. The telecom sector today is not a small one and covers various services and many players within each service. One of the most vibrant developments in telecommunications has been Cellular telephony – a technology that gives us the power to communicate anytime and anywhere. This segment, a part of the broader telecommunications industry, has today spawned an entire industry in mobile telecommunication. Mobile phones today are an integral part of growth, success and economic efficiency of businesses. The government in India has today recognized, providing world-class telecommunications infrastructure as the key to rapid economic and social development of the country. Although the industry requires huge capital investments and due to high entry barrier the sector is monopolized by small number of players.
  • Industry capacity: Conservative estimates put a tag of a 3% increase in the growth of GDP for every 1% rise in the tele-density in the nation. Accordingly, this sector has received a great thrust from the government for investments and development.In spite to huge demand matched up by the service providers there is mismatch between demand and supply in telecom industry are:
  • The demand for 3G and 4G spectrum is more among mobile phone service providers in many states of India but the supply of spectrum by the Government is not meeting the demand of the service providers.
  • The supply for landline telephones are more but the demand for landline telephones are getting reduced as a result extensive use of mobile phones and internet calling.
  • There is a demand for hi-speed internet connection in different parts of the country but those demands are not met by the service providers in telecom industry and the supply of broadband connection by service providers are not meeting the demand in market.
  • The supply of mobile connection by different mobile phone service providers is not meeting the demand generated by the people in the market.
  • The demand for manufacturing mobile phones by many mobile phone manufactures is increasing in India but the various policy of Indian government and restricted supply of raw materials is not meeting the demand of mobile phone manufacturers.
  • The supply of radio service is more in the country is more but the demand for radio services has decreased as a result of the involvement of visual media and other forms of communication.

Cost and Price Elasticity

The spectrum prices have increased considerably and as the result the expansion requires huge capital investment. Though the subscriber is increasing year on year, but due to heavy competition the tariff rates are lowest in the world. The call rates dropped from INR 16.80 in 1995 to INR 0.30 in 2012. Operators have been announcing new promotional schemes including reduction in tariffs for voice call, slashing roaming charges and many more such lucrative offers. Due to the fierce price war the profit margin and return of capital has been declining over the years. Providers are trying to maintain the profit margins by “economics of scale” and by providing “value added services”


Customers, due to competitive pricing have become “elastic” and easily switch to the provider who provides the services at a lower tariff. There is not much of brand loyalty as there is hardly any differentiation in the services. 


Profitability


India has almost 600m active mobile-phone subscribers—about one for every two people, including babies. It also has among the lowest prices anywhere, and a home-grown, world-class operator, Bharti Airtel. India's mobile-phone industry inspires great hopes. Prices have fallen to a level the poor can afford. Firms have become leaner, too. Bharti outsources furiously. Most companies share radio towers and have learned how to compress traffic.

Yet the industry is not getting the returns that corporation would expect. Only one of the big four firms was close to recouping its cost of capital last year, as the price war hit margins and an expensive 3G spectrum auction in 2010 bloated balance-sheets. Vodafone has a rich parent company but the others are now uncomfortably indebted. Middle-sized operators, meanwhile, are thought to be bleeding badly. Of the small fry, only two disclose figures: Uninor, run by Telenor, a Norwegian firm; and Russian-backed Sistema. Together they lost almost $2 billion of cashflow last year.

Operational and Asset Utilization Efficiencies

The telecom industry value chain is complex, so we have to divide it into network infrastructure, operations, distribution, creation of services, and customer acquisition, to understand where cost reduction is pertinent. Cost is currently pursued in the relevant areas such as infrastructure, operations, and distribution, since some of the services are commoditising, and capex-to-sales ratio for telcos is still very high. The Indian Telecom Network capacity utilization has been on the upswing with rising traffic. 3G network utilization however is still low given limited 3G handsets and have seen substantial tariff cuts by operators to increase data uptake. Point to note that there is no material differences across network operators both on 2G and 3G. Some of the major players are able to utilize their capacity well but small players are still struggling to get the market share (subscriber base) to utilize their full capacity.

Problems faced by the Industry


The heavy competition has following impacts to the industry: 

  • Market Saturation: The market is saturated with urban tele-density (number of telephones per 100 persons) reaching 167% and overall national average is 76%. Further increase of the customer base seems difficult in the coming years. 
  • Price War: The industry is one of the most competitive and has the lowest tariff rates than anywhere in the world. The call rates dropped from INR 16.80 in 1995 to INR 0.30 in 2012. Operators have been announcing new promotional schemes including reduction in tariffs for voice call, slashing roaming charges and many more such lucrative offers. Due to the fierce price war the profit margin and return of capital has been declining over the years. 
  • Declining ARPU: Average revenue per user (ARPU) has been falling year on year and most of the major players have been losing between 10 to 20% in ARPU and going to decline further. This trend is having negative impact on the bottom-line of all the players. The EPS for almost all telecom companies are going down and a result share prices is in a declining path.The tariff war and the trend in declining revenue per user is not a sustainable model going forward as bottom line growth is seems muted in the coming years.

Expected Changes in Next Five Years


While uncertainty looms large, the current TRAI recommendations of a high reserve price for the upcoming auctions is likely to deter new entrants and should aid in consolidation in the medium term. Sector outlook can change dramatically based on decisions on spectrum pricing and re-farming. With declining sources of revenue, a declining trend witnessed in ARPU’s and MOU’S, saturation of urban customer base, increasing competition and regulatory hurdles makes telecom an unfavorable play to be in at the moment and until there is a clear picture on revenue front which would come out after 3G auctions.

The way the industry is moving following trends can be seen in near future:

  • Infrastructure Sharing – A Profitable Proposition
The rapid expansion in subscriber base has brought to the fore the challenge of increasing and upgrading the telecom infrastructure to maintain quality of services. In the recent years, infrastructure sharing has emerged as a profitable proposition for both the parties involved, as for the tenant it lowers capex and opex, and for the owners, it is an additional source to earn revenue. It would lead to considerable reduction in initial set-up costs for new service providers and existing service providers planning to enter new service areas. Infrastructure sharing might assist the service providers to reduce their operating costs. The cost saving through infrastructure sharing could be passed on to the customers thereby augmenting their affordability. Further, with infrastructure sharing, the companies can reduce the time required to roll out the telecom services in the rural areas. The sharing of telecom infrastructure by companies could lead to optimum utilisation of these resources and thereby improve efficiency.

  • Managed Service – Outsourcing in Telecom
Managed Services typically involve the outsourcing of a specific technical function or capability to a Managed Service Provider (MSP). It is an alternative to in-house management or traditional outsourcing since firms/enterprises do not have to transfer complete control over assets/operations to the MSP but rather can contract or outsource specific management challenges for a shorter period of time. With the rapidly-growing subscriber base, managing infrastructure and networks is becoming increasingly difficult for the service providers. Therefore, many service providers have been outsourcing their infrastructure or network management operations completely or partially. Given the increasing demand for the managed services, the telecom equipment vendors could have an opportunity to take up more roles in the value chain by entering into managed service contracts.

Managed Services are fast-emerging as an attractive proposition for many enterprises that do not want to dedicate human resources and capital toward acquiring and administering technology infrastructure. It also allows the telecom service providers to focus on their core activities, to develop new and innovative products and services so as to distinguish themselves from other players in this highly-competitive market. The service providers can gain significantly in terms of cost reduction and improved efficiency in operations from the economies of scale that an MSP can offer.

Conclusion


The Indian mobile subscriber base is likely to sustain the rapid growth recorded in the past few years. Presence of skilled labour pool, improving telecom infrastructure, favourable demographics, rising disposable incomes of consumers, declining tariffs, increasing demand, growing attraction for mobiles with new features and greater availability of handsets at lower prices, are expected to continue driving the growth of the telecom sector, going forward.

However, the companies are likely to encounter a more challenging business environment in the near future, given the sustained fall in ARPUs, rapidly increasing competition and consequent pressure on margins and regulatory risks. Companies with good rural coverage, better operational efficiency, and superior quality of service are likely to stay ahead of competitors.

The industry will also witness the mergers of relatively smaller companies with the big players. Only big three or four players will dominate the market and direct price war may stop and Industry will agree on a standard pricing and competition will on the services and offerings.

Wednesday, August 22, 2012

Blue Ocean Strategy for Indian Telecom Industry


1.        Industry Background


Indian telecommunication market is one of the largest in the world, with the number of telecom subscribers second only to China's. In terms of infrastructure, India's telecommunication network is the third largest in the world on the basis of its customer base and it has one of the lowest tariffs in the world enabled by the hyper-competition in its market. The major sectors of the India telecommunication industry are telephony, internet and broadcasting. Indian telecom industry underwent a high pace of market liberalization and growth since 1990s and now has become the world's most competitive and one of the fastest growing telecom markets. India has the world's second-largest mobile phone user base with over 929.37 million users as of May 2012. It has the world's third-largest Internet user-base with over 121 million as of December 2011.


There are around 15 operators competing in the market for the telecom space in India. As per the latest annual report from Telecom Regulatory Authority of India (TRAI), the total revenue in the telecom service sector was INR 1,71,719 crore for the 2010-11 , growth of about 8.7% from the previous year. The capital employed in the sector increased from INR 2,86,837 crore in 2009-10 to INR 3,37,683 crore in 2010-11 i.e. an increase of 17.73 % indicating a healthy growth of investment in the sector.

2.        Why is it a Red Ocean?


Market Saturation: The market is saturated with urban tele-density (number of telephones per 100 persons) reaching 167% and overall national average is 76%. Further increase of the customer base seems difficult in the coming years. (Figure 1)

Price War: The industry is one of the most competitive and has the lowest tariff rates than anywhere in the world. The call rates dropped from INR 16.80 in 1995 to INR 0.30 in 2012. Operators have been announcing new promotional schemes including reduction in tariffs for voice call, slashing roaming charges and many more such lucrative offers. Due to the fierce price war the profit margin and return of capital has been declining over the years (Figure 2).

Declining Revenue: Average revenue per user (ARPU) has been falling year on year and most of the major players have been losing between 10 to 20% in ARPU and going to decline further. This trend is having negative impact on the bottom-line of all the players. The EPS for almost all telecom companies are going down and a result share prices is in a declining path.The tariff war and the trend in declining revenue per user is not a sustainable model going forward as bottom line growth is seems muted in the coming years.

There are three types of players in Indian telecom services:

  •             State owned companies (BSNL and MTNL)
  •             Private Indian owned companies (Reliance Infocomm, Tata Teleservices,)
  •       Foreign invested companies (Vodafone, Bharti Tele-Ventures, Idea Cellular, Uninor etc)
Foreign direct investment is increasing and new players are entering the market every year.


As-is strategy canvas of the Indian Telecom Industry
( Factors used to determine the Strategy canvas is described below)
  1. Price – Due to competitive nature the price is very low 
  2. Traditional mobile services – Talk, SMS, MMS, Ringtones etc. .Rated High as these are standard offerings by the operators. 
  3. Network Quality and coverage – The mobile infrastructure in India is still not up to the mark and the Quality of service is effected (rated low based on TRAI report) 
  4. Internet and broadband services – Most of the major players are offering this service but the quality and reach is not high. Hence a rating of average is given for this. 
  5. Pay for what you use – While most of the operators offer full talk time, but most of time operators add value added services like ringtone, daily astrology reports etc without customer consent. TRAI report also shows that there is deterioration on QoS in metering and billing credibility. The rating has been given Low. 
  6. Roaming Charges – Roaming charges in India are quire erratic and just moving even within a state attracts roaming charges although the operator does not incur in cost. 
  7. Variety in Usage plans – Every operator has multiple usage plans for both post pad and pre-paid services. Hence the rating of very high is given for this. 
  8. Traditional Value added services- Standard value added services like call forwarding, itemized billing, caller ringtones, music downloads are now a standard in the Indian telecom industry. However there is lot of scope for adding more features and hence the rating given is average 
  9. M Commerce – Though most of the providers offer this services , the penetration is still low because of security and customer awareness issue. 
  10. Video Calls – New 3G players are only offering his service but the pricing is very high. So this parameter has been ranked low. 
  11. Entertainment (music download, IPTV) - Penetration is quite low and most of the subscribers do not see much value in the in this offering. The main reason behind is the higher pricing and content not meeting expectations. Hence is parameter is ranked low. 
  12. Customer Services – Normally the high customer base is managed by comparatively lower customer support executives; the QoS in this parameter is low.


3.    Creating a Blue Ocean

Using the four action framework -Eliminate, Reduce, Raise and create following a following ERRC grid.
      Eliminate                                                           

  •      Variety of usage plans 
  •      Charges for Value added services like Call forwarding, Ringtones, itemized billing etc.
  •      Roaming Charges
  •      Video Calls
      Raise
  • Network Quality and Coverage
  • Internet and Broadband services
  • Pay for what you use
  • Entertainment (Music , IPTV)
  • M Commerce
      Reduce

  •       Traditional Value added services (via SMS) 


      Create
  • Private Networks
  • Wireless Health Care applications
  • Telco App Store


Eliminate:

1. The variety in usage plan can be completely eliminated and instead “pay for what you use “can be increased.

2. Customers do not consider some of the services which provider terms as value added , hence they should be eliminated

3. Most of the developed nations do not have roaming charges and India too can replicate that. If the subscriber is in a different mobile circle then a onetime nominal charge can be applied.

4. Video Calls requires high bandwidth usage and the locations where Indian subscribers use their mobile (on the go) is not suitable for Video chats. This segment can move to the internet service provides

Reduce:

1.   Traditional Value Added Services: Some of the so called value added services by Telco’s are actually SMS based and not really value added. Most of these services are push based which subscribers do not always want. Hence reducing this offering.

Raise:

1.   Network Quality and service – This is one area where most of the telco operators in India are not up to mark. Even major players like Bharti and Vodafone have signal, call disruption issues. Improving in this category will give higher customer satisfaction and customer retention.

2.   Internet and Broadband services – The broadband services offered by telcos are not up to expectation as the speed is quite low and pricing on the higher bandwidth segment is comparatively high. Improvement is this offering can bring in new customers who are on the move and requires internet connections on the move.

3.   Pay for what you use – New customer acquisition specially the mobile internet users is possible if this pricing policy is adapted.

4.   Entertainment – The entertainment offering is mostly restricted to music downloads and mobile TV in a low scale. This segment can be expanded with online gaming, books improved mobile TV and affordable prices, etc.

5.   M Commerce – M commerce (like Banking transaction, utility bill payment etc) have a big way to go as this offerings are at nascent stage. This will surely increase the revenue to telcos and acquire new customers.

Create:

1.    Private Networks – Small and medium enterprises who cannot invest to have dedicated networks can buy this offering from telcos.

2.    Wireless Heath Care applications – Personal aps such as patient monitoring systems, alerts, medicine refilling prescription etc can bring in new user base especially in the rural areas where mobile penetration is still low.

3.    Telco App stores – Telcos can generate revenue by providing new apps (like secure mobile payment apps, gaming, entertainment, news etc.

The creation of these services does not require high investments from Telecom operators and existing bandwidth can be utilized.
    
    To-be Strategy


4.        Blue Ocean – Create New Service lines

  
The next wave of subscriptions will come from semi-urban and rural areas. The penetration of mobile phones in urban areas is already more than 150% and in rural areas it is ~ 38% (Figure 1) As the 3G spectrum is becoming operational , focus must be given on the Non-Voice offerings in the urban sector and extend the basic services in the rural sector to capture the market. The strategy should to align to the above goals.

The top five to six products such as game based applications, music download continue to form close to 90% of VAS (Value Added Services) revenues, and have become easily replicable. The other types of services such as governance, education, and commerce constitute only 10-15% of VAS revenues, leaving large scope for growth.

In the rural segment:
  • Selling and procurement information and support for farm commodities 
  • Educating farming community on best practices 
  • Delivery of healthcare and education to remote village via the mobile broadband network 
  • Regional language content, and news 
  • Access to government services on Mobile-Based Service (MBS) platform individually or on CSC (Common Service Centre) model 
In the urban segment:
  • Mobile banking and commerce 
  • Tele-education 
  • Tele-medicine 
  • Location information, Area maps etc.
  • Home based services such as home security monitoring and personal emergency services
  • Easy access to services such as government services, utilities etc can be potential successes.
    
      The ERRC Grid will look like this
      Eliminate
  • Variety of usage plans 
  • Charges for Value added services like Call forwarding, Ringtones, itemized billing etc.
  • Roaming Charges
  • Video Calls
       Raise
  • Network Quality and Coverage
  • Internet and Broadband services
  • Pay for what you use
  • Entertainment (Music , IPTV)
  • M Commerce
      Reduce

  •       Traditional Value added services (via SMS)

      Create
  • · Private Networks
  • · Wireless Health Care applications
  • · Telco App Store
  • · Non Voice Services 
    • Real Time Agriculture information
    • Banking Services (Remittance, Micro Payments)
    • M-Governance
    • M-Education
    • Vernacular Content
    • Location Information and area maps
  • Home Based Services
    • Home Security Monitoring
    • Personal Emergency


     The Extended Strategy Canvas will look as below


5.        Conclusion


By using the framework we can conclude that “Blue Ocean” strategy can be applied to the Indian Telecom industry. The factors which come out are network quality and coverage, quality of customer service, Pay for what you use and better and more meaningful Value added services. .This new market strategy will help Indian Telecom operators to enhance their competitiveness in the existing market and capture new customers from the rural and semi-urban segment. Finally the implementation of India’s telecom industry has posed unique challenges for mobile operators. Although the market is competitive but there is lot more is possible to do enhance customer experience. Non Voice services are a great opportunity to rescue the industry from the declining ARPU.


However, stakeholders across the value chain will have to work collaboratively to overcome barriers and create a business ecosystem that generates fair rewards for all the players.

References: